Stochastic Oscillator: Master Overbought & Oversold Signals for Funded Trading
Unlock the power of the Stochastic Oscillator. Learn to identify overbought and oversold signals in Forex, avoid false reversals, and trade with.

What is the Stochastic Oscillator? (Concept Definition)
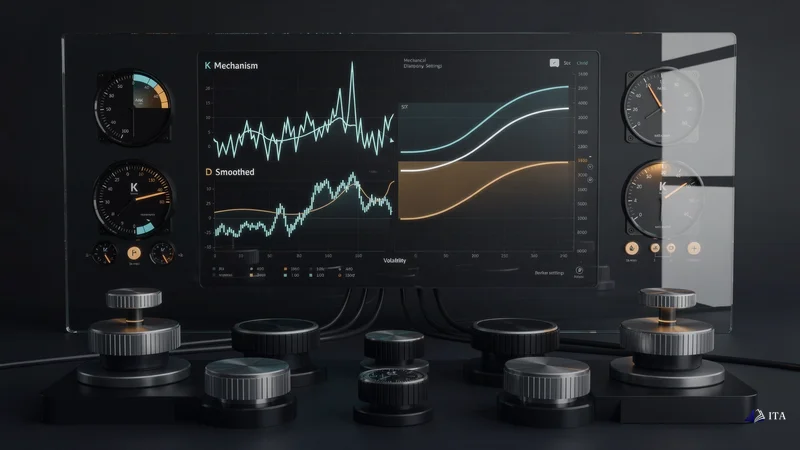
The stochastic oscillator is a momentum indicator that compares the current closing price to the price range over a specific period, typically 14 sessions. Created by George Lane in the 1950s, it generates two lines: %K (the raw stochastic value) and %D (a smoothed moving average of %K), both oscillating between 0 and 100 to identify momentum shifts.
Here's where the break happens — the moment that separates the 87% who fail from the 13% who consistently profit:
The stochastic oscillator works brilliantly, but not as a reversal indicator. It works as a momentum gauge that helps you time entries in the direction of the dominant trend. When you flip your entire mental model of the indicator, everything changes.
In an uptrend, you don't sell overbought readings. You wait for the stochastic to pull back from overbought, ideally dipping below 50 or even touching 20, then watch for it to turn back up. That pullback represents a pause in momentum, a brief exhale in the upward march. When momentum resumes (stochastic turning up from the pullback), you have your entry signal in the direction of the trend.
The same logic applies in reverse for downtrends. You don't buy every oversold reading. You wait for rallies that push the stochastic up from oversold, then look for momentum to roll over again as your signal to sell with the trend.
Identifying Overbought and Oversold Signals (Visual Explanation)
Overbought signals occur when the stochastic oscillator rises above 80, whilst oversold signals appear below 20, with traditional settings using a 14-period lookback and a 3-period moving average for the %D signal line. The %K line shows how close current price sits within the recent range, whilst %D smooths these readings to reduce false signals during volatile periods.
But here's what most tutorials skip: these default settings aren't sacred. The 14-period lookback made sense when Lane developed the indicator for daily commodity charts. In today's forex market, with its 24-hour cycles and varying volatility across sessions, successful traders adjust these parameters based on their timeframe and the pair's characteristics.
On a 15-minute chart for scalping EUR/USD, a 5-period stochastic might capture the micro-swings better than the default 14. On a 4-hour chart for swing trading GBP/JPY, you might extend to 21 periods to smooth out the notorious volatility. The key is matching the indicator's sensitivity to your trading horizon.
For example, if EUR/USD trades at a certain level and the stochastic oscillator has rolled down from above 80 (where it sat during recent highs) toward the middle range. If you pull up a 4-hour chart, you'll likely see the stochastic oscillator has rolled down from above 80 (where it sat during yesterday's highs above 1.14) toward the middle range. This isn't a "sell signal" — the pair already sold off. It's a momentum gauge showing the immediate upward pressure has eased.
For a trend-following trader, this creates opportunity. If EUR/USD finds support around 1.1350 and the stochastic begins turning up from below 50, you have momentum resuming in a pair that's been in an uptrend on the daily timeframe. You're not fighting the larger trend by shorting "overbought" readings. You're flowing with it by buying the momentum resumption after a pullback.

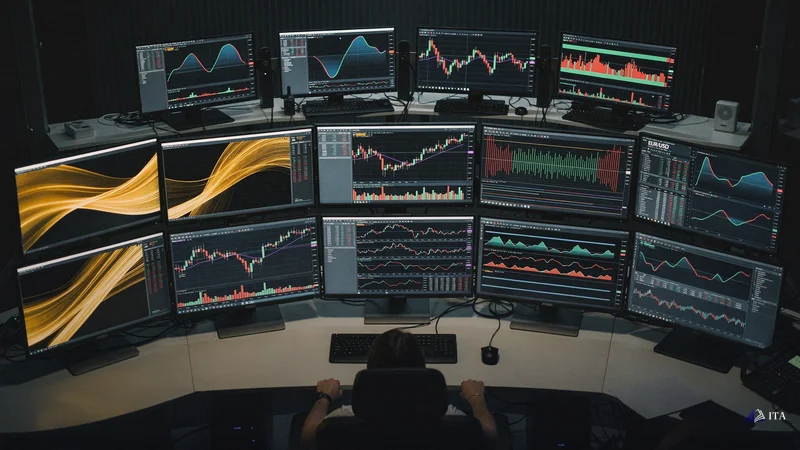
Stochastic Oscillator in Action: Real Forex Examples
Real forex examples demonstrate how the stochastic oscillator behaves across different market conditions and currency pairs. In trending markets like gold's recent decline
The visual representation of these concepts transforms abstract numbers into actionable intelligence. Picture a forex chart with the stochastic oscillator beneath it. The indicator oscillates between 0 and 100, with horizontal lines typically drawn at 20 and 80 to mark the traditional oversold and overbought zones.
But here's the visual trick that changes everything: instead of seeing those zones as reversal triggers, imagine them as momentum strength meters. Above 80 means "powerful upward momentum." Below 20 means "powerful downward momentum." The money isn't made by fading these extremes, it's made by recognising when momentum pauses and then resumes.
Watch for this pattern: in an uptrend, price rallies and pushes stochastic above 80. Then comes a pullback, price dips, stochastic falls back toward 50 or even 20. This is the market taking a breath. When stochastic turns back up from that pullback, especially if price holds above a key support level, you have a high-probability continuation setup. Our guide on RSI Divergence Trading Strategy covers this in more depth.
The %K/%D crossover adds another layer of confirmation. When the faster %K line crosses above the slower %D line after a pullback in an uptrend, it suggests momentum is accelerating back in the trend direction. But, and this is crucial, the crossover alone isn't enough. You need the broader context: the trend direction, the location relative to support/resistance, and ideally some price action confirmation like a bullish candlestick pattern.
Common Mistakes with Stochastic Overbought/Oversold Signals
Now for the mistakes that destroy funded accounts. The first and deadliest: ignoring the higher timeframe trend. A trader sees stochastic hit 85 on the 15-minute chart and immediately shorts EUR/USD. But zoom out to the 4-hour or daily chart and you discover the pair is in a strong uptrend, breaking through resistance levels. That 15-minute "overbought" reading is just noise in a larger bullish symphony.
The second killer: treating every signal as an automatic entry. The stochastic hits oversold, so you buy. No consideration of support levels. No analysis of trend structure. No confirmation from price action. This mechanical approach turns the indicator into a random entry generator.
Third: not waiting for price action confirmation. The stochastic suggests momentum is turning, but price hasn't confirmed it yet. Maybe stochastic has turned up from oversold, but price continues making lower lows. The indicator is diverging from price, a warning sign, not an entry signal. Wait for price to actually reverse and confirm what the momentum indicator is suggesting.
The fourth mistake is perhaps the subtlest: over-reliance on default settings. Those 14-3-3 parameters work as a starting point, but every currency pair has its own personality. EUR/USD trends smoothly, so default settings might work well. GBP/JPY whips around violently, potentially requiring longer periods to filter out noise. USD/CHF moves in smaller ranges, possibly benefiting from more sensitive settings. One size doesn't fit all markets.
Let's make this practical with a step-by-step exercise you can execute right now. Open your trading platform and load EUR/USD on a 1-hour chart. Add the stochastic oscillator with default settings (14,3,3). Now follow this process:
Practical Exercise: Integrating Stochastic into Your Trading Plan
Step 1: Define your trend filter. Add a 200-period moving average to your chart. If price is above it, you'll only look for long entries. Below it, only shorts. This simple rule immediately cuts your potential losses in half by keeping you aligned with the dominant force.
Step 2: Identify key support and resistance levels. Mark the obvious swing highs and lows from the past week. These are your battleground levels where momentum shifts actually matter. A stochastic signal at a random price level carries less weight than one at a proven support zone.
Step 3: Look for stochastic signals in the trend direction. If the trend is up (price above 200 MA), wait for stochastic to pull back below 50. When it turns back up, especially between 20-50, you have a potential entry signal. But don't trade yet.
Step 4: Confirm with candlestick patterns. When stochastic gives your signal, examine the actual price bars. Look for bullish patterns at support in uptrends: hammer candles, bullish engulfing patterns, or morning star formations. These show buyers stepping in at exactly the moment momentum suggests they should.
For example, if EUR/USD trends above its 200 MA. The stochastic has pulled back to 35 after being overbought. Price sits just above support. You see a bullish hammer candle form right at support as the stochastic begins turning up. The stochastic has pulled back to 35 after being overbought yesterday. Price sits just above support at 1.1370. You see a bullish hammer candle form right at support as the stochastic begins turning up. All elements align, trend, momentum, location, and price action confirmation.
Stochastic Oscillator and ITA's Institutional Approach
This is where ITAfx's institutional approach transforms indicator usage from gambling to probability-based execution. At Institutional Trading Academy, the focus isn't on finding the perfect indicator settings or the magic combination that works everywhere. It's about understanding what each tool actually measures and using it within a comprehensive framework.
The stochastic oscillator, in ITA's methodology, never stands alone. It's one instrument in an orchestra. The trend filter keeps you on the right side of the market. Support and resistance levels tell you where reactions are likely. The stochastic helps time your entry within those larger parameters. And strict risk management, never risking more than a small fraction of account equity per trade, ensures no single misread can damage your funded account.
This contextual approach is why ITAfx traders learn to think in probabilities, not certainties. An oversold stochastic in a downtrend isn't a buy signal, it's information suggesting momentum might pause. Combined with other factors, it might become part of a trading decision. Or it might be wisely ignored if the broader context doesn't support action.
The institutional edge isn't about complex formulas or proprietary indicators. It's about discipline, context, and understanding what your tools actually tell you. When you stop trying to catch every top and bottom with overbought/oversold signals and start using momentum to time entries with the trend, the stochastic oscillator transforms from an account killer to a precision timing tool. Our guide on RSI Divergence Explained covers this in more depth.
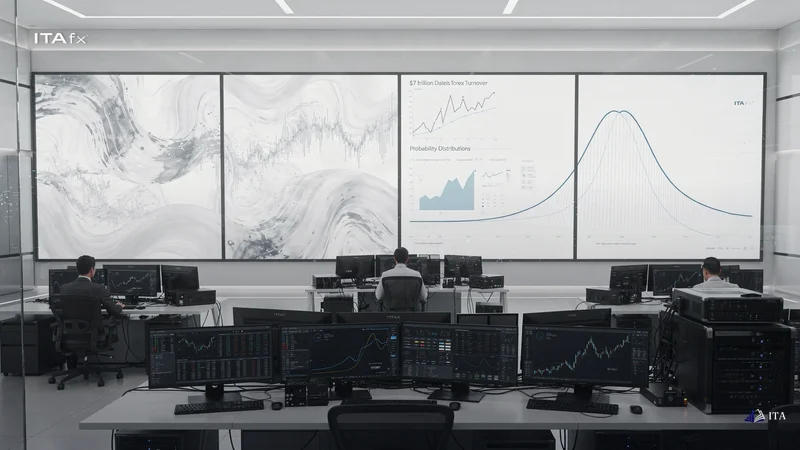
According to the Bank for International Settlements, daily forex turnover reached $7.5 trillion in April 2022. In these deep, liquid markets, momentum can persist far longer than retail traders expect. The institution moving EUR/USD doesn't care that your 15-minute stochastic says "overbought." They have a position to build, and they'll keep buying until it's complete.
Frequently Asked Questions
What are the best stochastic oscillator settings for intraday forex trading?
For intraday forex trading, a 5-period stochastic works better than the default 14 on 15-minute charts for EUR/USD scalping. On 4-hour swing trading charts, extend to 21 periods to smooth GBP/JPY volatility. Match the indicator's sensitivity to your trading timeframe and the pair's characteristics for optimal results.
How reliable are overbought and oversold stochastic signals in strong trends?
In strong trends, stochastic can remain overbought above 80 for weeks whilst price climbs another 200 pips. Overbought readings in uptrends often mark momentum pauses, not reversals. The key is using stochastic to time entries with the trend, not against it.
How do %K/%D crossovers improve overbought/oversold signal accuracy?
When the faster %K line crosses above the slower %D line after a pullback in an uptrend, it suggests momentum is accelerating back in the trend direction. However, the crossover alone isn't sufficient, you need trend context, support/resistance levels, and price action confirmation like bullish candlestick patterns.
What timeframes work best for stochastic in funded account trading?
At ITAfx, traders typically use 1-hour charts with default 14-period settings for swing trades, and 15-minute charts with 5-period stochastic for scalping. The key is matching timeframes to your risk management rules, funded account constraints favour longer timeframes that reduce overtrading and preserve capital.
What common mistakes do beginners make when using stochastic in forex?
The deadliest mistake is ignoring higher timeframe trends, shorting overbought readings on 15-minute charts whilst the daily trend is strongly bullish. Other fatal errors include treating every signal as automatic entry, not waiting for price action confirmation, and using default settings across all currency pairs without adjustment.
Key Takeaways
- Use stochastic oscillator as momentum gauge, not reversal signal — readings above 80 mean strong upward momentum, not sell signals.
- Wait for stochastic pullbacks below 50 in uptrends, then buy when momentum resumes upward with price action confirmation.
- Adjust default 14-period settings based on timeframe — 5-period for 15-minute scalping, 21-period for volatile pairs like GBP/JPY.
- Combine stochastic signals with 200-period moving average trend filter to avoid counter-trend trades that destroy accounts.
- Look for %K/%D crossovers after pullbacks in trending markets, never as standalone entry signals without price confirmation.
- Avoid trading stochastic signals during low-liquidity sessions — prioritise London and New York overlaps for cleaner momentum reads.
- Never fight extended overbought readings in strong trends — EUR/USD can stay above 80 for weeks during institutional buying.
Start Your Trading Evaluation
Simulated funded accounts up to $800K. Up to 95% profit split.
Get Funded