 ITA
ITAWilliams %R Explained: Why It Measures Range Position, Not Momentum
Unlock the power of Williams %R. Learn its formula, how to interpret overbought/oversold signals, and how to integrate it into your trading strategy for funded accounts.
Short answer
Unlock the power of Williams %R. Learn its formula, how to interpret overbought/oversold signals, and how to integrate it into your trading strategy for funded accounts. In a prop firm context this still sits under simulated-capital rules: fees buy access to the evaluation or funded environment, not a deposit of trading capital.
Simulated capital: prop firm evaluation and funded stages discussed here typically run on simulated accounts. Challenge fees pay for access to that environment; they are not a deposit of trading capital. ITAfx accounts are simulated capital.


What is the Williams %R Momentum Indicator?
The Williams %R momentum indicator measures the position of the current closing price relative to the high-low range over a specified period, typically 14 days. If you're watching gold surge to 4187.30 (+2.58%) or the Nasdaq tumble to 29329.21 (-1.49%), this oscillator helps determine whether these moves have reached overbought or oversold extremes.
Most traders reach for momentum indicators to answer that question. RSI, MACD, Stochastic, the usual suspects. But there's one indicator that approaches this problem completely differently, and most traders use it wrong because they don't understand what it's actually measuring.
Williams %R doesn't measure momentum. It measures mathematical position within a range.
This distinction matters more than you think. While momentum indicators tell you how fast price is moving, Williams %R tells you something far more useful: where price sits within its recent high-low range. It's the difference between knowing a car is accelerating and knowing it's 10 feet from the cliff edge.
The indicator's creator, Larry Williams, designed it with a specific philosophy that most modern traders have forgotten. In his original formulation, he used a 10-day range and expressed values from 0% (overbought 'Yang') to 100% (oversold 'Yin'), with precise rules: buy when Percent R hits 100% and then falls back below 95% in bull markets. Notice something? He wasn't using it as a momentum oscillator. He was using it as a mean-reversion tool.
And here's where everything changes.
Visualizing Williams %R: Interpreting Overbought and Oversold Zones
Modern platforms flipped Williams %R to an inverted scale from 0 to -100. This wasn't just a cosmetic change, it fundamentally altered how traders perceive the indicator. When you see -20, your brain thinks "low number, weak momentum." But that's exactly backwards. At -20, price is near the TOP of its recent range, not the bottom.
The formula reveals the truth:
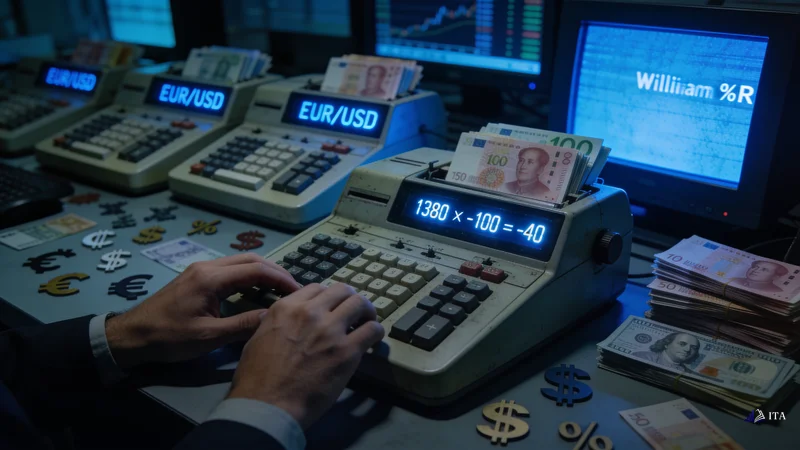
Williams %R = (Highest High - Close) ÷ (Highest High - Lowest Low) × -100
Let me decode this. When EUR/USD trades at 1.1440, and its 14-day high is 1.1480 while its low is 1.1380, the calculation becomes:
(1.1480 - 1.1440) ÷ (1.1480 - 1.1380) × -100 = -40
That -40 reading tells you EUR/USD sits 40% down from the top of its recent range. Not weak, just positioned closer to recent highs than lows. This is pure range analysis, not momentum measurement.
Real-World Application: Trading with Williams %R in Forex Markets
The real insight comes from understanding what this means for your trading.
According to Stock Charts analysis, Williams %R is mathematically the inverse of the Fast Stochastic Oscillator. They use identical high-low range logic, but Williams %R plots upside-down on a negative scale. This isn't a bug, it's a feature. The inverted scale forces you to think differently about extremes.
When Williams %R shows -10 (near 0), price has pushed to the very top of its recent range. The mathematical probability of continuing higher diminishes, not because momentum is weak, but because price has exhausted the recent range. Conversely, at -90 (near -100), price sits at the bottom of its range, creating mean-reversion opportunity.
This explains why thinkorswim's analysis emphasises that Williams %R works best in non-trending or range-bound markets. In a strong trend, price can remain "overbought" or "oversold" for extended periods. But in ranging markets, which dominate forex pairs most of the time, these extremes become high-probability reversal zones.
Let's see this in action with real market data.
Take gold's current surge to 4187.30. If gold's 14-day range spans from 4050 to 4200, Williams %R would calculate:
(4200 - 4187.30) ÷ (4200 - 4050) × -100 = -8.5

Common Mistakes and How to Avoid Them with Williams %R
That -8.5 reading screams "extreme." Not because momentum is weak, gold is up 2.58%, but because price sits just 12.70 points from its 14-day high. The mathematical space for continuation shrinks. This is where amateur traders get it wrong. They see gold rallying and Williams %R near zero, so they think "overbought, time to sell." But selling into momentum without context is how accounts get destroyed.
The professional approach requires a deeper understanding. According to Larry Williams' own trading rules, readings between 0 and -20 indicate overbought conditions, while -80 to -100 suggest oversold. But these aren't automatic signals. They're context markers. In a strong uptrend, Williams %R can remain overbought for days or weeks. The key is watching for the indicator to exit the extreme zone, that's when mean reversion becomes probable.
This brings us to the most common mistakes traders make with Williams %R.
First, they trade every extreme reading. When Williams %R hits -15, they immediately short. When it touches -85, they buy. This mechanical approach ignores trend context and leads to repeated stops in trending markets. The indicator shows position within range, not reversal timing.
Second, they ignore the overall trend. If EUR/USD trends higher on the daily chart but shows -85 on the hourly Williams %R, that's not a sell signal, it's a potential pullback entry in the trend direction. The timeframe relationship matters.
Third, they use Williams %R alone. Quantified Strategies' backtesting demonstrates that Williams %R works best as a mean-reversion tool when combined with other filters. Their testing shows buying when %R exits oversold (moves above -80) and selling when it exits overbought (drops below -20), not at the extremes themselves.
The fourth mistake is perhaps the most damaging: using default settings without understanding them. The standard 14-period lookback works for daily charts, but what about 5-minute charts? A 14-period Williams %R on a 5-minute chart only looks back 70 minutes, hardly enough context for meaningful range analysis. Professionals adjust the lookback period to match their trading timeframe: 5-7 periods for scalping, 14-21 for day trading, 20-50 for swing trading.
Practical Exercise: Setting Up Williams %R in third-party platform
Now let's get practical with a third-party platform setup exercise.
Open third-party platform and load EUR/USD on a 4-hour chart. Navigate to Insert → Indicators → Oscillators → Williams' Percent Range. Set the period to 21 (slightly longer than default for clearer signals on this timeframe). Change the colour to bright blue for visibility against your chart background.
Now add horizontal lines at -20 and -80. But also add lines at -50 (the midpoint), -10, and -90. These additional levels help gauge range position more precisely. When price pushes past -10 or -90, you're seeing true extremes that warrant attention. Our guide on Bollinger Bands Squeeze Strategy Forex covers this in more depth.
Next, overlay a 50-period moving average on your main chart. This simple addition transforms Williams %R from a standalone indicator to a trend-filtered system. When price sits above the MA and Williams %R drops to -80, you're seeing a potential trend continuation entry, not a reversal. When price trends below the MA and Williams %R hits -20, consider it a retracement within the downtrend.

Integrating Williams %R into a Disciplined Trading Plan for Funded Accounts
To practice reading the signals, scroll back on your chart and identify every instance where Williams %R exceeded -10 or -90. Mark these points. Now note how many immediately reversed versus how many continued pushing. You'll quickly see that extreme readings alone don't predict reversals, they simply indicate range extremes.
This understanding becomes crucial when trading funded accounts.
At ITAfx, where traders manage funded accounts up to $400K, risk management isn't optional, it's mandatory. The 6% maximum loss and 3% daily loss limits mean you cannot afford to fight trends or take low-probability reversal trades. Williams %R, properly understood, helps you avoid these account-killers.
Instead of trading every extreme, funded traders use Williams %R as a filter. When managing a $200K funded account, a 1% position means $2,000 at risk. You cannot waste that capital on fighting a trend just because Williams %R shows -15. But when Williams %R exits an extreme zone in the direction of the prevailing trend, probability shifts in your favour.
The connection to funded trading goes deeper. ITAfx's methodology emphasises systematic approaches over discretionary decisions. Williams %R provides objective range measurements that remove emotional interpretation. When gold pushes to -8.5 on Williams %R, that's not an opinion, it's mathematical fact that price sits near the range extreme. Our guide on Bollinger Bands Trading Strategy covers this in more depth.
This objectivity matters because excessive trading tends to reduce overall returns due to added costs and poor timing. Funded traders cannot afford this performance drag. By using Williams %R to identify high-probability setups rather than chasing every move, you preserve capital and maintain the consistency required for funded account success.

Conclusion: Master Williams %R for Consistent Trading Edge
The indicator Larry Williams created wasn't designed to chase momentum. It was designed to identify when price had travelled too far within its recent range and become vulnerable to mean reversion. Modern traders who understand this original intent, and adjust for the inverted scale psychology, unlock the indicator's true power.
Next time you see gold at 4187.30 with Williams %R at -8.5, you'll know exactly what it means. Not weak momentum in a strong move, but price pushed to the extreme edge of its recent range. Whether you trade that information depends on trend context, risk management, and your funded account rules. But at least now you're reading the map correctly.
That's the difference between using Williams %R and understanding it. One leads to whipsaws and stopped-out trades. The other leads to consistent, probability-based setups that keep funded accounts growing. At ITAfx, where discipline meets capital, that difference determines who succeeds.
The math doesn't lie. Neither should your interpretation of it.
Ready to get funded?
50% off instant accounts with code 50CRYPTO.
Get Funded →Frequently Asked Questions
How is Williams %R calculated and why is the scale inverted from 0 to −100?
Williams %R is calculated as (Highest High - Close) ÷ (Highest High - Lowest Low) × -100, typically using a 14-period lookback. The inverted scale forces traders to think differently about extremes: -20 means price is near the TOP of its recent range, not weak momentum.
What is the difference between Williams %R and the Stochastic Oscillator?
Williams %R is mathematically the inverse of the Fast Stochastic Oscillator. They use identical high-low range logic, but Williams %R plots upside-down on a negative scale from 0 to -100, while Stochastic uses 0 to 100.
How do traders use Williams %R to identify overbought and oversold conditions?
Readings between 0 and -20 indicate overbought conditions, while -80 to -100 suggest oversold levels. However, these aren't automatic reversal signals, they show position within range. Professional traders wait for the indicator to exit extreme zones before taking action.
Can Williams %R be used effectively in trending markets?
Williams %R works best in non-trending or range-bound markets where overbought/oversold extremes reliably precede reversals. In strong trends, the indicator can remain at extremes for extended periods, making it less reliable for reversal timing.
How do funded trading programs encourage disciplined use of Williams %R?
At ITAfx, funded traders use Williams %R as a filter rather than trading every extreme reading. With 6% maximum loss limits on funded accounts up to $400K, traders cannot afford to fight trends based solely on overbought/oversold signals.
Key Takeaways
- Williams %R measures price position within range, not momentum strength, at -20, price sits near the top of its recent range.
- Use the inverted scale correctly: -10 indicates extreme overbought (near range top), -90 shows oversold (near range bottom).
- Combine Williams %R with trend analysis, never trade against the prevailing trend based solely on extreme readings.
- Exit signals matter more than entry extremes, watch for Williams %R moving above -80 or below -20 for reversal confirmation.
- Adjust the lookback period to match your timeframe: 5-7 periods for scalping, 14-21 for day trading, 20-50 for swing trading.
- Set horizontal reference lines at -10, -20, -50, -80, and -90 for precise range position assessment in third-party platform.
- Apply the 50-period moving average filter to distinguish trend continuation entries from counter-trend reversal attempts.
Ready to get funded?
Instant accounts, simulated capital, rules published before you pay. 50% off with code 50CRYPTO.
Get Funded →