 ITA
ITARSI Divergence: Unlock Reversals & Continuations in Funded Trading
Master RSI divergence patterns to spot potential trend reversals and continuations in funded trading.
Short answer
Master RSI divergence patterns to spot potential trend reversals and continuations in funded trading. In a prop firm context this still sits under simulated-capital rules: fees buy access to the evaluation or funded environment, not a deposit of trading capital.
Simulated capital: prop firm evaluation and funded stages discussed here typically run on simulated accounts. Challenge fees pay for access to that environment; they are not a deposit of trading capital. ITAfx accounts are simulated capital.


What Are RSI Divergence Patterns and Why They Matter
RSI divergence occurs when price moves in one direction while the Relative Strength Index moves in the opposite direction, revealing that the current trend is losing internal strength. This disconnect between price action and momentum is often misunderstood, not because the concept is complex, but because most traders apply it mechanically without understanding the deeper market dynamics at play. The divergence shows changes in order flow. When price pushes to new highs while RSI fails to confirm, it signals that fewer market participants are willing to chase the move at current levels. The momentum calculation within RSI, comparing average gains to average losses over a period, captures this reluctance mathematically. As buying pressure weakens relative to the price advance, RSI diverges lower, creating the classic bearish divergence pattern. For funded traders operating within strict drawdown limits, divergence patterns serve a specific role: they identify potential inflection points where risk-reward ratios shift dramatically. A 6% maximum drawdown account cannot afford to chase extended moves or hold through deep retracements. Divergence provides an early warning system, not a reversal guarantee, but a signal to tighten stops, reduce position size, or prepare for potential market structure changes.
Identifying Regular (Classic) RSI Divergence for Reversals
Bearish divergence forms when price prints a higher high while RSI prints a lower high, signalling that upward momentum is fading despite the nominal price advance. The key to accurate identification lies in connecting the correct peaks, always use candle closes, not wicks, as technical analysis tutorials emphasize. This distinction matters because wicks represent temporary price extremes often driven by stop hunting or news spikes, while closes reflect where the market actually settled.
Bullish divergence operates on the inverse principle: price makes a lower low while RSI makes a higher low, indicating that selling pressure is exhausting even as price probes new depths. The most reliable bullish divergences emerge from oversold conditions below 30 on the RSI scale, where significant reversal setups tend to develop. At these extreme readings, the mathematical relationship between average gains and losses becomes stretched, increasing the probability of mean reversion.
Drawing divergence lines correctly requires precision and patience. Connect only the most recent, clearly defined swing points, forcing connections between distant or ambiguous peaks leads to false signals. The divergence should be visually obvious without manipulation. If you need to squint or adjust your perspective to see it, the market isn't showing clear divergence. Professional traders wait for clean, unmistakable patterns rather than hunting for signals that barely exist.
But here's what transforms divergence identification from academic exercise to practical trading tool: the concept of divergence strength.
Mastering Hidden RSI Divergence for Trend Continuations
Hidden divergence signals trend continuation rather than reversal, it appears when price pulls back within an established trend but momentum indicators suggest the trend will resume, giving traders an entry opportunity after temporary corrections. Hidden bullish divergence appears when price makes a higher low but RSI makes a lower low, typically during pullbacks within established uptrends. This pattern reveals that while price has pulled back less severely than before, the internal momentum has reset more deeply, creating potential energy for the next leg higher. Hidden bearish divergence manifests as price making a lower high while RSI makes a higher high during bear market rallies. The mechanics here are subtle but powerful: the market is telling us that despite a weaker price bounce, internal momentum has recovered more than expected, suggesting the rally is corrective rather than impulsive. These continuation patterns reinforce existing trends rather than fighting them. The distinction between regular and hidden divergence lies in their relationship to trend structure. Regular divergence appears at potential trend termination points, the exhaustion of a move. Hidden divergence emerges during trend pauses, the market catching its breath before continuing. Funded traders who grasp this distinction avoid the costly mistake of fading strong trends based on regular divergence while missing high-probability continuation entries signaled by hidden divergence.
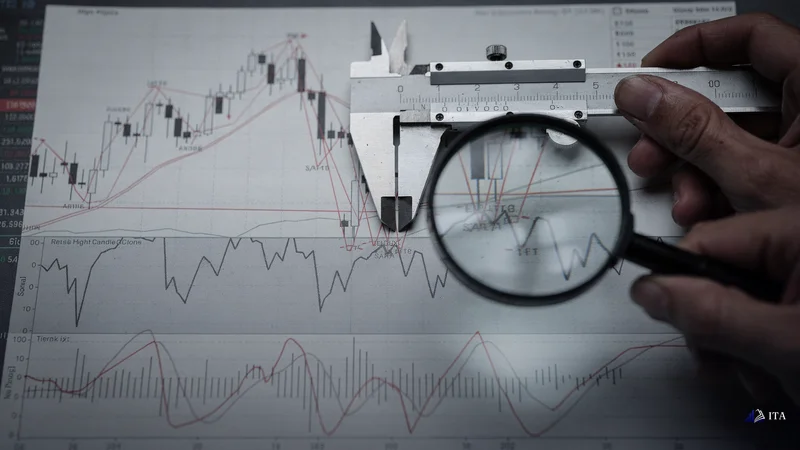
Common Mistakes and How to Avoid False RSI Divergence Signals
The most expensive mistake in divergence trading is attempting to catch reversals in strongly trending markets. RSI divergence fails most often in strong trends, where price can continue in the dominant direction despite repeated divergence signals. Consider the current US100 level at 29,825, in such a sustained uptrend, bearish divergences might appear multiple times before any meaningful reversal materialises. Each premature entry based on divergence alone becomes a drawdown event.
Forcing patterns where none exist represents another critical error. Traders desperate for signals often connect non-adjacent peaks, use inconsistent timeframes, or mix body and wick connections to manufacture divergence. This confirmation bias leads to entries based on imagined patterns rather than actual market structure. The solution is mechanical: establish rigid rules for what constitutes valid divergence and never deviate. If the pattern doesn't meet every criterion, it doesn't exist.
Ignoring overbought and oversold conditions undermines divergence reliability. Regular divergences gain significance when emerging from extremes, RSI above 70 or below 30, because these levels represent statistically stretched conditions. A bearish divergence forming with RSI at 65 carries far less weight than one emerging from above 75. The mathematical extremes create the conditions for powerful reversals; divergence merely times the entry.
Yet the most overlooked mistake is treating divergence as a signal rather than a process.

Combining RSI Divergence with Support & Resistance for High-Probability Setups
Divergence becomes actionable when combined with price structure. A bullish divergence forming at a major support level, where buyers have previously defended price, carries more weight than divergence in empty space. The confluence creates a convergence of technical factors: momentum suggesting exhaustion, price reaching a historical decision point, and market memory of previous reactions at that level. Confirmation through price action remains non-negotiable. The RSI midline cross at 50 serves as a momentum filter, bullish divergence gains credibility when RSI crosses above 50, confirming the momentum shift from bearish to bullish. Similarly, bearish divergence signals require RSI to break below 50 to validate the momentum reversal. This additional filter eliminates many false signals that plague pure divergence strategies. Stop placement and profit targets around divergence trades follow structural logic rather than arbitrary ratios. Stop losses belong beyond the divergence extreme, below the low that created bullish divergence or above the high that formed bearish divergence. This placement ensures that if the divergence fails and price continues its original trajectory, the trade exits with minimal damage. Profit targets align with the next significant resistance (for longs) or support (for shorts), creating asymmetric risk-reward profiles essential for funded account success.

Real Market Examples: RSI Divergence in Action
Examining major indices reveals how divergence plays out in real markets. When indices push to new highs on declining volume and weakening breadth, RSI often diverges bearishly before any price confirmation appears. When indices approach recent highs, price may print marginal new highs while RSI shows lower peaks. Aggressive traders who shorted immediately faced continued upside to current levels. Patient traders who waited for price structure breakdown, a close below the previous day's low, entered with better timing and defined risk.
Gold (XAU/USD) often demonstrates bullish divergence in practice. When gold tests key support levels multiple times, the second test may show bullish divergence if RSI makes higher lows. The second test printed a marginally lower low in price, but RSI showed a clear higher low, suggesting selling exhaustion. The divergence alone wasn't sufficient, but when combined with a long-term ascending trendline and the psychological 4,100 level, it created a high-probability reversal setup. The subsequent bounce validated the divergence signal.
Analysing divergence across timeframes adds crucial context. A bearish divergence on the 15-minute chart means little if the daily chart shows strong bullish momentum. Conversely, when multiple timeframes align, hourly, 4-hour, and daily all showing divergence, the signal gains statistical significance. At ITAfx, funded traders learn to weight divergence signals based on timeframe confluence, avoiding the whipsaw of lower timeframe noise while respecting higher timeframe structure.
This brings us to the revelation that separates profitable divergence traders from the majority who lose.

Advanced Tips for Integrating RSI Divergence into Your Trading Plan
Volume provides the missing context that transforms divergence from interesting observation to tradeable signal. When price makes new highs on declining volume while RSI diverges bearishly, it confirms that fewer participants are driving the move. This volume divergence, often overlooked in forex due to decentralised market structure, becomes visible through tick volume or futures contract volume. The confluence of price/RSI divergence with volume divergence creates institutional-grade signals.
Combining RSI divergence with complementary indicators enhances signal quality without overcomplicating analysis. MACD divergence often precedes RSI divergence, providing early warning. Moving average positioning adds trend context, bullish divergence below a declining 200-period average faces headwinds, while the same signal above a rising average aligns with the dominant trend. The key is using indicators that measure different market aspects: RSI for momentum, MACD for trend strength, moving averages for direction.
Journaling divergence trades reveals patterns invisible in real-time trading. Document not just the divergence signal but the surrounding context: trend strength, support/resistance levels, volume characteristics, and multiple timeframe alignment. Over time, patterns emerge, perhaps your bullish divergences work best in ranging markets but fail in downtrends, or bearish divergences succeed primarily at round numbers. This data-driven refinement, rather than theoretical optimisation, builds genuine edge.
Bulkowski's research confirms that indicator divergence alone has limited predictive power, it must be integrated into a complete trading methodology. For funded traders managing evaluation or funded accounts up to $400K, this means incorporating divergence as one factor in a multi-factor model. Position sizing adjusts based on signal strength, risk management follows account preservation rules, and psychology maintains discipline through drawdowns. Our guide on RSI Divergence Trading Strategy covers this in more depth.
The revelation is this: profitable divergence trading isn't about finding the perfect signal, it's about managing positions across multiple divergence events, scaling in as evidence accumulates, and accepting that the first divergence signal is often early. This process-oriented approach aligns with institutional methodology, where positions build over time rather than betting everything on a single technical signal.

Ready to get funded?
50% off instant accounts with code 50CRYPTO.
Get Funded →Frequently Asked Questions
What exactly is RSI divergence in simple terms?
RSI divergence occurs when price moves in one direction while the Relative Strength Index moves the opposite way. For example, if EUR/USD makes a new high but RSI makes a lower high, that's bearish divergence, suggesting the uptrend is losing momentum despite the higher price.
How reliable are RSI divergence patterns for funded account trading?
Divergence patterns alone show limited reliability, especially in strong trends where multiple divergences can appear before any reversal. However, when combined with support/resistance levels and proper confirmation, they become valuable tools for timing entries and managing risk within funded account parameters.
Should I use wicks or candle bodies when drawing divergence lines?
Always use candle closes (bodies) rather than wicks when identifying divergence. Wicks represent temporary extremes often caused by news spikes or stop hunting, while closes show where the market actually settled and provide more reliable divergence signals.
What's the difference between regular and hidden divergence?
Regular divergence signals potential reversals, price makes a new extreme but RSI doesn't confirm it. Hidden divergence signals trend continuation, during a pullback in an uptrend, price makes a higher low but RSI makes a lower low, suggesting the trend will resume after the correction.
How do I avoid false divergence signals in trending markets?
Combine divergence with trend analysis and wait for price confirmation. In strong uptrends, ignore bearish divergences unless price breaks key support. Focus on hidden bullish divergences during pullbacks instead. Never trade divergence against the dominant trend without additional confirming factors.
Key Takeaways
- Use candle closes, not wicks, when drawing divergence lines to avoid false signals from temporary price spikes.
- Focus on hidden divergence during trending markets, it signals continuation rather than reversal, avoiding costly counter-trend trades.
- Combine RSI divergence with support/resistance levels and wait for RSI midline crosses at 50 for confirmation.
- Trade divergences from extreme RSI levels (above 70 or below 30) where statistical mean reversion is most likely.
- Set stops beyond the divergence extreme and target the next structural level for asymmetric risk-reward profiles.
- Journal divergence trades with context, trend strength, volume, timeframe alignment, to identify your highest-probability setups.
- Scale position size based on divergence strength and multiple timeframe confluence rather than betting everything on single signals.
Ready to get funded?
Instant accounts, simulated capital, rules published before you pay. 50% off with code 50CRYPTO.
Get Funded →