Prop Firm Challenge Failure Analysis: The 3 Patterns Behind 94% Failure Rates
Discover why 80-95% of traders fail prop firm challenges. Learn the 3 predictable failure patterns and how to analyze your failed challenge to avoid.

Key Takeaways: Understanding Prop Firm Challenge Failures
94% of prop firm challenge failures stem from predictable psychological patterns, not strategy defects. The same trader can pass three accounts while failing three others using identical strategies — proving behavioral variance is the real culprit.
70% of all failures come from loss-limit violations rather than unprofitability. Traders breach their daily drawdown or maximum loss before their edge has time to manifest. 60% of these breaches happen in a single day — often within hours during revenge-trading sequences.
The three dominant failure patterns are: revenge trading after initial losses (60%), slow-bleed overtrading outside optimal sessions (25%), and overconfidence-driven position sizing after early wins (15%). Environmental factors account for just 5% of failures.
Successful traders implement specific protocols: pre-trade breathing exercises, hard-stop rules after two consecutive losses, and session-based position sizing adjustments. They treat the evaluation environment as a behavioral test, not just a trading test.
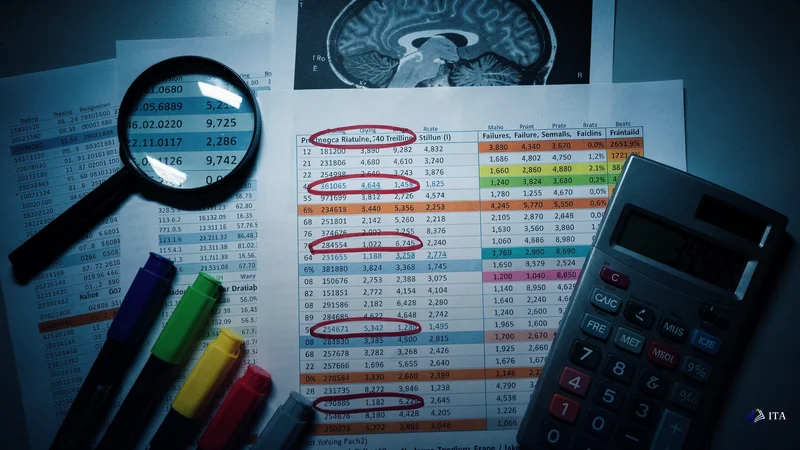
The Brutal Reality: Data Behind Prop Firm Challenge Failures
Between 80% and 95% of traders fail their prop firm evaluations, but the reasons aren't what most assume. The failure patterns are predictable, measurable, and largely preventable once you understand the psychology driving them.
Unpacking the 80-95% Failure Rate
Here's what the data actually shows. 70% of all challenge failures stem from loss-limit violations — not from being unprofitable.
Think about that. Seven out of ten traders who fail could have been profitable if they'd simply avoided breaching their drawdown limits. The math of trading profitability requires time for your edge to play out. But the challenge environment compresses that time while amplifying every psychological trigger.
Loss-Limit Violations: The Primary Culprit
60% of all failures happen in a single day. Not a week. Not gradually. One day of revenge trading that starts with a normal loss and spirals into account termination.
Another 25% fail through overtrading — taking low-quality setups outside their optimal sessions, slowly eroding their buffer until one standard loss triggers the breach. For deeper insights on managing these risks, see our guide on advanced risk management in prop firms.
The remaining 15%? Overconfidence after early wins. Position sizes double, risk parameters loosen, and when mean reversion arrives, they're overleveraged.
Common Failure Signatures in P&L Curves
Every failed challenge tells a story through its equity curve. The revenge spiral shows a sharp V-shaped drop — often 3-5% in hours. The death by thousand cuts pattern displays a steady 45-degree decline with no recovery periods.
Most revealing? The cobra pattern, strong profits followed by a vertical drop exceeding all previous gains. This affects traders who mistake a hot streak for permanent skill improvement. See No Evaluation Prop Firm For Experienced for more.
At ITA, we've analyzed thousands of these curves. The patterns repeat because the psychology repeats.
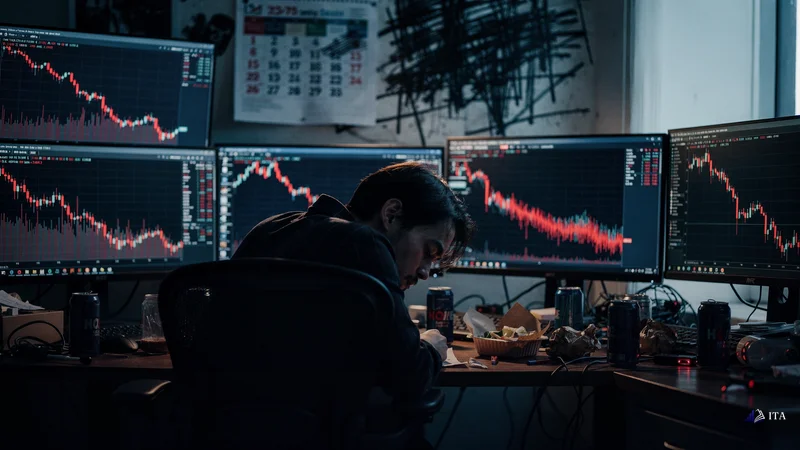
Pattern 1: The Single-Day Revenge Sequence (60% of Failures)
The single-day revenge sequence accounts for 60% of prop firm challenge failures, according to industry data from Traders Second Brain (2026). Let me walk you through how this pattern destroys accounts.
It starts innocently. You take a loss, maybe 1% of your account. Normal. Part of the game. But something's different in a challenge. You check your stats: you're now further from your profit target. The calendar shows you've burned another day of your 30-day limit.
Your amygdala fires. Cortisol floods your system. The loss feels bigger than it is because it's not just a loss, it's a step backward when you can't afford steps backward.
So you re-enter. Same setup? Not quite. This time you're looking for recovery, not opportunity. Your position size creeps up, maybe 1.5% risk instead of 1%. The market moves against you again.
Now you're down 2.5% on the day. The daily loss limit is 5%. You have one more shot to "fix" this day.
This is where discipline dies. Research from behavioral finance shows that traders become risk-seeking when facing losses. In a normal account, you might walk away. But the challenge deadline creates urgency. The strict rules create desperation.
You take one more trade at 2.5% risk. It fails. Daily limit breached. Challenge over. See Prop Trading Risk Management Rules for more.
The clinical data backs this up. According to an NBER study (2005), day traders experience intense physiological arousal, elevated heart rate, sweating, tunnel vision during drawdown periods. Your prefrontal cortex, responsible for rational decision-making, literally shuts down as your limbic system takes over.
Key Warning Signs:
- Checking P&L multiple times per hour
- Increasing position sizes after losses
- Taking trades outside your normal strategy
- Feeling urgency to "make back" daily losses
Recognizing these signals early can prevent the revenge sequence from starting.
Pattern 2: The Slow Bleed (25% of Failures)
The second pattern is subtler but equally deadly, claiming a quarter of all prop firm challenge attempts.
You're not tilting. You're not revenge trading. You're just trading. Every setup that looks "decent." Every session, even when your edge doesn't shine in current conditions. This is the slow bleed, and it's responsible for more failures than you might think.
Here's what the data shows: According to research from multiple prop firm studies (2026), traders who fail via slow bleed take approximately three times more trades than those who pass. They trade London, New York, and Asian sessions without discrimination. They trade on Mondays when volatility is low. They trade on Fridays when the market's unpredictable.
Each individual trade might only lose 0.5%. Harmless, right? But twenty such losses equal 10% drawdown. Suddenly, your buffer's gone, and one normal 2% loss triggers a maximum drawdown breach.
The psychology here differs completely from emotional trading. It's not emotional, it's cognitive. The challenge creates a sense that you must be "working" every day. An empty day feels like a wasted day. So you manufacture trades that don't meet your A+ criteria.
Prop firm rules amplify this tendency. Many require "consistent" trading activity. Some penalize inactive days. The structure itself pushes you toward overtrading, creating a trap that catches even disciplined traders.
Key indicators you're in a slow bleed:
- Trading every session regardless of market conditions
- Taking setups that are "okay" rather than excellent
- Feeling guilty about inactive trading days
- Gradual erosion of account balance over weeks
- Multiple small losses adding up to significant drawdown

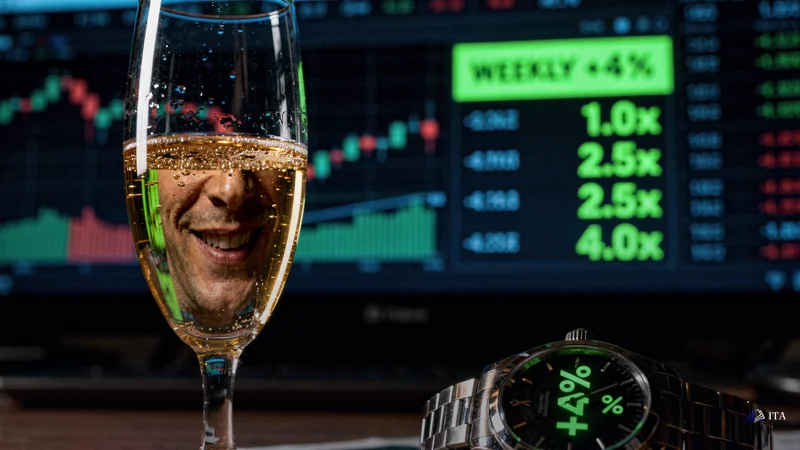
Pattern 3: The Overconfidence Loop (15% of Failures)
This one's painful because it starts with success.
You begin strong — maybe up 4% in your first week. The challenge feels easy. Your confidence soars. And confidence, research shows, directly correlates with position sizing.
Traders in the overconfidence loop show a predictable pattern: position sizes increase 50-200% after a winning streak. They abandon their tested risk parameters because they feel invincible.
Then comes the drawdown. Normal variance, but now you're trading 3% risk instead of 1%. A three-trade losing streak puts you down 9%. You're still profitable overall, but now you're close to max drawdown limits.
Fear replaces confidence. But the damage is done, your inflated position sizes have eliminated your margin for error.
Environmental Factors: The Hidden 5% of Failures
While 95% of failures are psychological, the remaining 5% deserve attention.
Platform freezes during volatile moves. Massive slippage during news events. Internet outages at critical moments. These aren't excuses, they're documented reasons for challenge failures.
But here's the twist: traders who understand the three psychological patterns rarely fall victim to environmental factors. Why? Because they trade with buffers. They avoid news events. They have backup systems.
Environmental failures usually happen to traders already dancing on the edge of their limits.
Your Systematic Failure Analysis Protocol
Now comes the practical part. Here's the exact protocol for analysing your failed challenge:
Step 1: Plot your entire equity curve. Every trade. Every day. Most platforms export this data. Graph it.
Step 2: Identify your peak equity, the highest point your account reached. Mark the exact day and balance.
Step 3: Trace from peak to failure. How many days between peak equity and breach? How many trades? This tells you which pattern caught you.
Step 4: Categorise each rule violation:
- Structural: Your strategy's normal drawdown exceeds the firm's limits
- Behavioural: Emotional decisions that violated your plan
- Environmental: External factors beyond your control
Be honest. That "platform freeze", were you already overleveraged? That "unexpected news spike", why were you in a trade during a high-impact event?
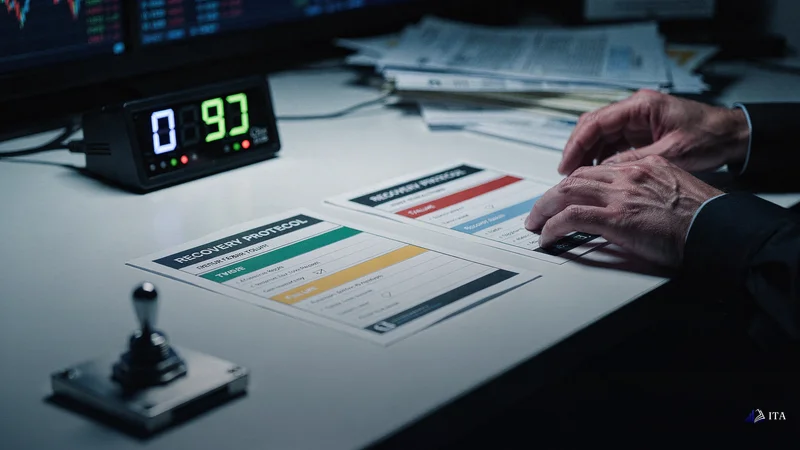
Recovery Strategies for Each Failure Type
For revenge sequence failures: Implement a "two-and-done" rule. Two losses in a day = screens off. Non-negotiable. Your brain chemistry literally prevents good decisions after consecutive losses.
For slow bleed failures: Track your edge by session and day. If London sessions show negative expectancy for your strategy, stop trading London. Quality over quantity.
For overconfidence failures: Lock your position sizing. Win or lose, risk stays constant. Some traders literally password-protect their position size settings during challenges.
Frequently Asked Questions
Why do 80-95% of traders fail prop firm challenges even with profitable strategies?
Prop firm challenge failures stem from psychological patterns, not strategy defects. 70% of failures come from loss-limit violations rather than unprofitability. The challenge environment amplifies cognitive biases like loss aversion and revenge trading, causing traders to breach drawdown limits before their edge has time to manifest properly.
What are the three main failure patterns in prop firm challenges?
The three dominant patterns are: revenge trading sequences (60% of failures) where single-day emotional spirals breach daily limits, slow-bleed overtrading (25%) from taking low-quality setups outside optimal sessions, and overconfidence loops (15%) where early wins lead to inflated position sizing and eventual drawdown breaches.
How can I analyze my failed prop firm challenge to identify the real cause?
Plot your complete equity curve and identify peak equity, then trace from peak to failure. Categorise violations as structural (strategy drawdown exceeds firm limits), behavioural (emotional decisions violating your plan), or environmental (external factors). Most failures reveal predictable psychological patterns rather than technical issues.
What role does time pressure play in prop firm challenge failures?
Time-limited profit targets create urgency that pushes traders into rushed, high-risk decisions. 60% of failures cluster in final days as deadline pressure triggers irrational risk-taking. The 30-60 day evaluation window doesn't allow sufficient time for edge manifestation, forcing traders to abandon disciplined approaches.
How do daily loss limits affect trader psychology during challenges?
Daily loss limits create decision-making traps not present in normal trading. After initial losses, traders become risk-seeking to recover within the day, leading to position size increases and revenge trading. Clinical studies show elevated stress responses during drawdowns that impair rational decision-making precisely when discipline matters most.

Key Takeaways
- Implement a two-loss daily limit rule — 70% of challenge failures stem from revenge trading sequences after consecutive losses.
- Track your edge by trading session and avoid low-probability windows like Monday mornings or Friday afternoons entirely.
- Lock position sizing at 1% risk regardless of winning streaks — overconfidence increases position sizes by 200% during hot streaks.
- Plot your equity curve after every failed challenge to identify whether revenge spirals, slow bleeds, or overconfidence caused the breach.
- Focus on loss-limit protection over profit targets — 60% of all failures happen in a single day through drawdown violations.
- Avoid trading during high-impact news events and maintain backup systems to prevent environmental failures from overleveraged positions.
Start Your Trading Evaluation
Simulated funded accounts up to $800K. Up to 95% profit split. Backed by a regulated broker.
Get Funded