Forex Correlation Risk: Position Sizing for Prop Traders
Unlock advanced forex correlation analysis for prop trading. Learn to manage portfolio risk, identify hidden double exposure, and execute dynamic hedging.

Data sourced from market data providers. Chart shows recent price action for educational purposes only. Past performance does not indicate future results.
| Asset | Price | 24h Change | |
|---|---|---|---|
| XAU/USD (Gold) | $4354.50 | +3.30% | ▲ |
| US30 (Dow Jones) | 51845.46 | +0.94% | ▲ |
| US100 (Nasdaq 100) | 30512.04 | +0.70% | ▲ |
| EUR/USD | 1.16005 | +0.37% | ▲ |
Why Correlation Analysis is Critical for Prop Traders in 2026
The funded traders who survive these regime shifts share a specific approach. They don't ask "what's correlated?" They ask "what's my total exposure to the underlying driver?" When USD weakens, they know their EUR/USD long, gold long, and Nasdaq long all express the same core bet. The correlation matrix doesn't reveal opportunity, it reveals concentration risk.
This shift from signal-seeking to risk-mapping changes everything about position sizing. Instead of the retail formula (pick risk per trade, then calculate position size), institutional correlation frameworks work backwards. Start with maximum acceptable portfolio heat. If you can handle 6% total drawdown across all positions, and you're running three highly correlated trades, each gets 2% allocation at most. But here's where it gets sophisticated: that 2% isn't static.
Professional prop desks apply what's called the "correlation reduction factor." When two positions show 0.80 correlation, the second position gets sized at (1 - 0.80) = 20% of normal. Running EUR/USD and GBP/USD together? That second position might be five times smaller than if traded alone. This isn't conservatism — it's arithmetic. Two positions with 0.80 correlation contain 1.2 units of directional risk, not 2.0. Our guide on Forex Correlation Pairs Trading covers this in more depth.
The calculation mechanics matter less than the mindset shift. Funded traders who last don't see positions as independent bets. They see a portfolio expressing various factors: USD exposure, risk sentiment, yield differentials, commodity trends. The correlation matrix becomes a real-time map of factor concentration. When correlations spike, as they do during macro events, exposure must compress.
Mastering the Correlation Matrix: Calculation and Monitoring
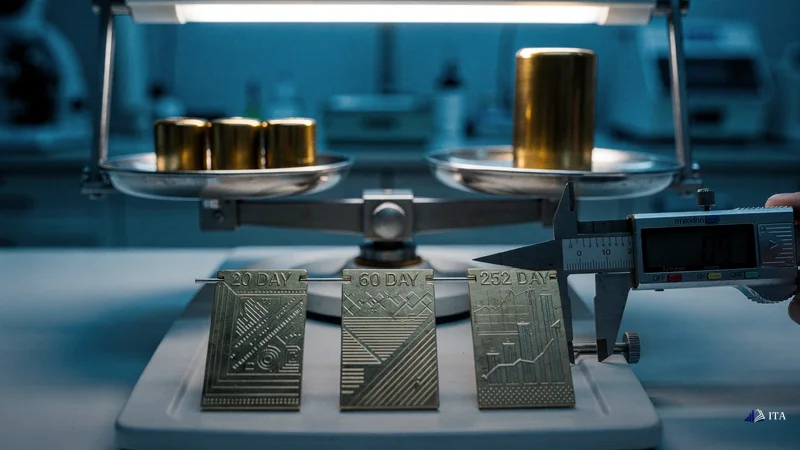
Correlation matrices calculate the statistical relationship between asset price movements, typically measured over rolling 20-day, 60-day, and 252-day periods using Pearson correlation coefficients. A trader long EUR/USD, long gold, and long Nasdaq isn't running three trades, they're running one macro bet with three expressions that share underlying risk factors.
Multi-timeframe validation adds the temporal dimension most traders miss. A correlation might read 0.85 on the daily chart but 0.40 on the 4-hour. Which one matters? For funded traders, both do, but at different stages. Position entry requires correlation stability across at least two timeframes. If daily shows 0.75 but 4-hour shows 0.30, that's not a correlation, it's noise. The professionals wait for alignment: strong correlation (above |0.70|) on multiple timeframes, stable for 5+ days, before treating positions as linked.
This temporal filtering prevents the whipsaws that destroy retail accounts. During the March 2020 COVID shock, correlations that seemed stable for months inverted in hours. Gold and equities, traditionally uncorrelated, moved in lockstep as everything became a liquidity trade. Traders using single-timeframe correlation got caught. Those requiring multi-timeframe confirmation had already reduced exposure when shorter timeframes diverged from longer ones. Our guide on Forex risk management funded account guide 2026 covers this in more depth.
The real edge comes from dynamic hedge adjustment, the missing piece in most correlation strategies. Static hedging says: long EUR/USD, hedge with short USD/CHF at fixed ratio. Dynamic hedging continuously adjusts that ratio based on three inputs: correlation coefficient, relative volatility, and regime stability.
Correlation Thresholds and Group Exposure Limits in Prop Desks
The formula used by systematic prop strategies: Hedge Ratio = Primary Position Size × Correlation Coefficient × (Hedge Volatility / Primary Volatility). If EUR/USD-USD/CHF correlation is -0.80, EUR/USD ATR is 80 pips, and USD/CHF ATR is 60 pips, your hedge ratio is 0.80 × (60/80) = 0.60. For every 1.0 lot EUR/USD, you need 0.6 lots USD/CHF to maintain balanced exposure. But here's the institutional insight: when 4-hour correlation drops below 0.50 or flips sign, the hedge gets cut or closed entirely. Correlation breakdown is a regime change signal. Maintaining a hedge through correlation breakdown multiplies risk rather than reducing it. This brings us to the portfolio construction framework that separates funded traders from retail: instrument clustering by driver, not by asset class. Forex pairs, commodities, and indices get grouped by what moves them: - USD Strength Cluster: USD/JPY, USD/CHF, DXY-correlated pairs
- Risk-On Cluster: AUD/JPY, NZD/JPY, S&P 500, Nasdaq
- Haven Cluster: Gold, JPY crosses, Swiss franc, Treasury futures
- Commodity Cluster: CAD, AUD, NOK, crude oil, copper
Dynamic Hedging Strategies with Correlation and Volatility Adjustment
Dynamic hedging adjusts position sizes based on real-time correlation shifts and volatility changes, treating correlated assets as unified risk clusters rather than independent positions. Maximum exposure per cluster, not per instrument — if the risk-on cluster can take 3% portfolio heat, that's shared across all risk-on positions based on correlation strength.
Live monitoring becomes non-negotiable at this level. Static correlation tables from last month mean nothing during NFP week. Tools that display real-time correlation matrices are widely available, but professionals go further. They track correlation stability (how long has it held?), correlation dispersion (are all pairs moving together or just the majors?), and correlation breaks (when did historical relationships fail?).
The current market demonstrates why this matters. Traditional correlation says rising yields should pressure gold. Yet gold rallies alongside equities while yields climb. This isn't correlation "breaking", it's regime transition. Perhaps inflation expectations are rising faster than nominal yields, making real yields less negative. Perhaps dollar weakness overwhelms yield support. The correlation matrix doesn't explain why, it just signals that yesterday's assumptions don't apply today. Our guide on Correlation Trading Strategies for Forex Prop Firms covers this in more depth.
For prop firm traders specifically, correlation analysis solves the hidden problem that breaks most accounts: inadvertent concentration during evaluation phases. A trader might respect the 3% daily loss limit on each position but run three positions expressing the same macro factor. When that factor reverses, they hit daily loss limits across multiple positions simultaneously. The risk manager sees three separate trades. The market sees one concentrated bet.
Building Your Correlation Playbook: Practical Applications for Funded Accounts
Correlation playbooks translate statistical relationships into actionable position sizing and risk management rules for funded trading accounts. Prop firm risk desks increasingly monitor "factor exposure" alongside position limits, recognising that correlation-aware position sizing isn't just good practice, it's becoming mandatory for larger funded accounts.
The implementation playbook for funded accounts distills to five components:
First, establish correlation thresholds that trigger position adjustment. Above 0.70, positions get grouped. Above 0.85, the second position might be halved or skipped entirely. Below 0.50, positions trade independently. Between 0.50-0.70 is the gray zone requiring additional confirmation.
Second, calculate position sizes from portfolio heat backwards. If maximum acceptable drawdown is 6% and you're trading three correlated instruments, start each at 2% risk. Then apply correlation reduction: 0.80 correlation means the second position gets 0.2 × 2% = 0.4% risk allocation.

Advanced Concepts: Macro Events, Yields, and Cross-Asset Correlations
Cross-asset correlations between forex, bonds, and equities shift during macro events, requiring multi-timeframe monitoring to detect regime changes before they impact portfolio risk. Weekly, daily, and 4-hour correlations should align within 0.20, divergence signals regime transition and demands reduced size or market exit.
Fourth, adjust hedges dynamically based on correlation and volatility. Never maintain static hedges through correlation breakdown. When correlation drops below 0.50 or changes sign, the hedge becomes a second directional bet.
Fifth, think in factors, not instruments. Map every position to its core driver: USD strength, risk sentiment, yield differentials, commodity trends. Maximum risk per factor, not per position.
The advanced layer involves cross-asset correlation during macro catalysts. When U.S. yields rise, the playbook says: USD up, gold down, equities mixed. But correlation analysis might show gold and equities moving together, suggesting the market prices something different, perhaps fiscal dominance, perhaps inflation breakout, perhaps positioning unwind.
Levels shown reflect recent price range and moving averages for informational purposes only. Not financial advice.
Frequently Asked Questions
How do prop traders use forex correlation matrices to avoid hidden double exposure?
Prop traders apply correlation reduction factors to position sizing when instruments show correlation above 0.70. If EUR/USD and GBP/USD correlate at 0.80, the second position gets sized at (1-0.80) = 20% of normal allocation. This prevents concentrated exposure to the same underlying driver like USD weakness.
What correlation thresholds are most useful for forex prop desk risk management?
Professional prop desks use 0.70 as the trigger threshold for group exposure limits. Correlations above +0.70 or below -0.70 indicate strong relationships requiring position adjustment. Values between -0.70 and +0.70 are treated as weak correlation, allowing independent position sizing across instruments.
How often do forex correlations change during macro event weeks?
Correlations can shift dramatically during macro events, often spiking or inverting within hours. Professional traders require correlation stability across multiple timeframes for 5+ days before using positions as hedges. During high-impact releases like NFP or FOMC, correlation monitoring becomes critical as relationships break down.
What is the best lookback period for calculating reliable forex correlations?
Most prop desks use multi-timeframe validation with 20-day, 60-day, and 252-day lookback periods. For intraday trading, correlation must align across daily and 4-hour timeframes within 0.20 to be considered reliable. Single-timeframe correlations often produce false signals during regime transitions.
How does ITA teach correlation analysis for funded account risk management?
At ITA, correlation analysis focuses on factor exposure mapping rather than pair relationships. Traders learn to group positions by underlying drivers (USD strength, risk sentiment, yield differentials) and apply maximum risk per factor, not per instrument. This institutional approach prevents hidden concentration during evaluation phases.
Start Your Trading Evaluation
Simulated funded accounts up to $800K. Up to 95% profit split.
Get Funded